In a not so shocking turn of events, President Joe Biden announced on Sunday, July 21st, that he will not seek re-election in the upcoming 2024 presidential race. Biden’s sudden departure has thrust Vice President Kamala Harris into the spotlight as she all but officially secured the Democratic nomination. With the general election campaign now officially underway, early polls and models provide a glimpse into the state of the race between Harris and former President Donald Trump.
Analyzing the Polls
Polling data collected over the past few weeks reveals a competitive race between Trump and Harris. Overall, the RealClearPolitics (RCP) shows Trump leading Harris by 1.7 points, with Trump at 47.6% and Harris at 45.9%.
Here are some of the the latest polls: Trump 48% / Harris 46
CNN (7/22 - 7/23): Trump 49%, Harris 46% (Trump +3)
Forbes/HarrisX (7/19 - 7/21): Trump 53%, Harris 47% (Trump +6)
Quinnipiac (7/19 - 7/21): Trump 49%, Harris 47% (Trump +2)
Reuters/Ipsos (7/22 - 7/23): Harris 44%, Trump 42% (Harris +2)
NPR/PBS/Marist (7/22 - 7/22): Trump 46%, Harris 45% (Trump +1)
Overall, the RealClearPolitics (RCP) average from June 28th to July 24 shows Trump leading Harris by 2 points, with Trump at 48% and Harris at 46%.
Models and Simulations
To gain deeper insights into the race, we utilized two sophisticated models, Modus and Concordia, which incorporate a wide range of data points, including polling averages, economic indicators, and demographic factors. We’ve updated the models with Harris’ metrics (polling, approval rating, and favorability) with key economic indicators that she will inherit as the incumbent from Joe Biden. Admittedly, the models may not be useful at this point and probably won’t be until after the Democratic National Convention in August. In any case, it does help shed light on the state of the race and the challenges Harris will inherit leading the Democrat ticket.
Here are the key findings:
Modus Model Results:
Composite Score for Harris: 3.865
Projected National Popular Vote (NPV) for Harris: 45.83%
Concordia Model Results:
Composite Score Calculation:
Approval Rating: 39%
GDP Growth: 1.4%
Inflation Rate: 3%
ISM Manufacturing Index: 48.5
Unemployment Rate: 4.1%
Polling: 46%
Total Composite Score for Harris: 4.11
Projected NPV for Harris: 46.93%
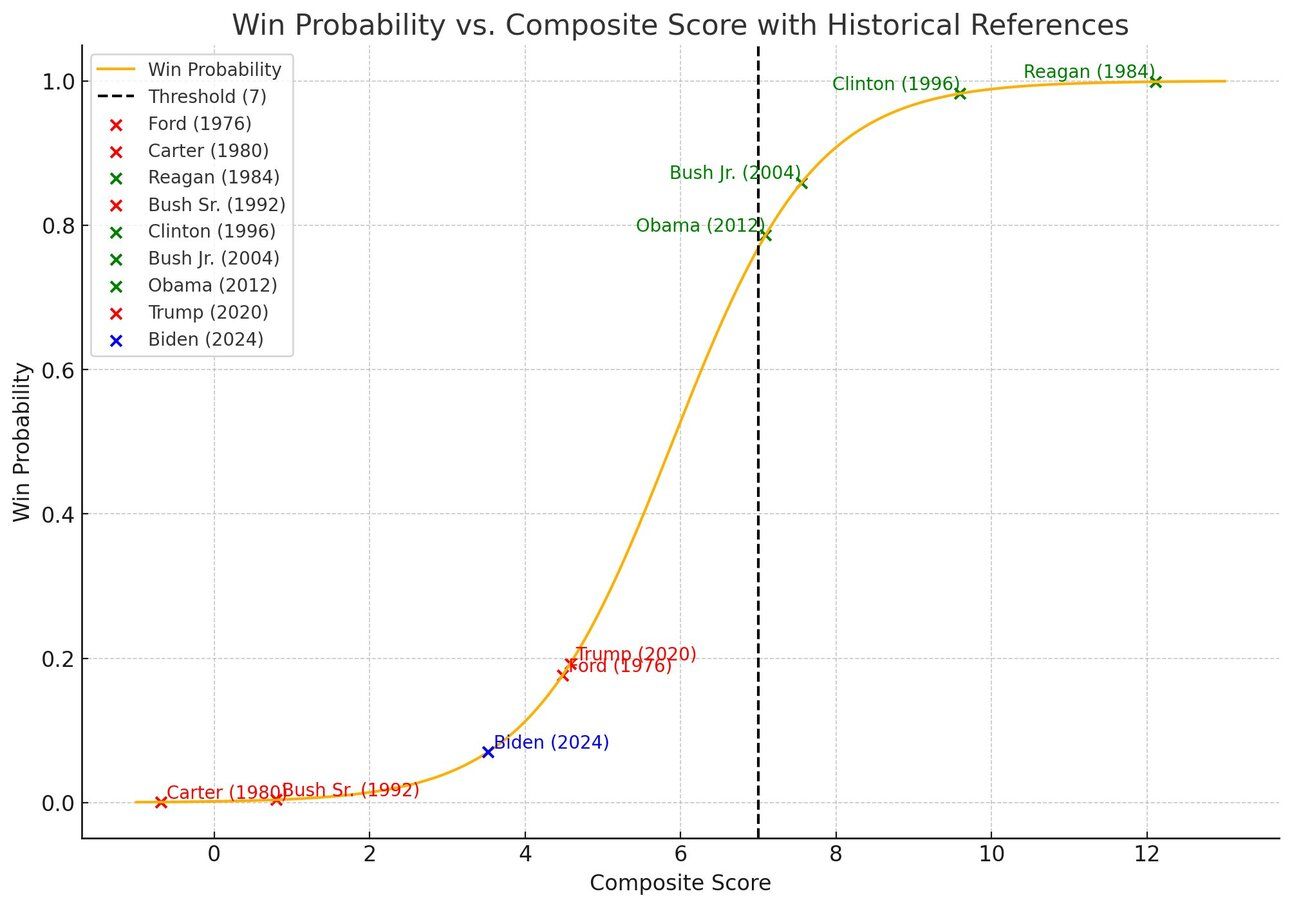
Based on her composite scores, both models give Kamala Harris relatively low win probabilities, between 15 to 18 percent. For example, her combined composite score of 3.98 is roughly comparable to Trump’s and Ford’s scores of 4.58 and 4.48, respectively. The model determined their chances of re-election to be around 16 to 20 percent based on at least a 7 point composite score threshold for reelection. For example, from the historical data, with Biden included here, we observe that presidents with a composite score above approximately 7 win re-election, while those below 7 lose. However, there is variance in the model and an incumbent with a composite score of 6 is generally seen competitive with at least even odds to win reelection.
Demographic Analysis
To further understand the dynamics of the race, we created a synthetic electorate model of 1000 registered voters based on recent polling data and demographic information. Here are the key figures:
White Non-College Educated Voters (40.3% of the electorate):
Trump: 66%
Harris: 29%
Other: 5%
White College Educated Voters (30.7% of the electorate):
Trump: 44%
Harris: 51%
Other: 5%
Hispanic Voters (11.8% of the electorate):
Trump: 43%
Harris: 51%
Other: 6%
Black Voters (11.4% of the electorate):
Trump: 12%
Harris: 82%
Other: 6%
Other Voters (5.8% of the electorate):
Trump: 38%
Harris: 56%
Other: 6%

To gain deeper insights into potential election outcomes, we added variance to the demographic voting percentages and conducted 10,000 simulations. This approach allows us to account for possible shifts in voter behavior within each demographic group. For instance, we adjusted the support for Trump and Harris within a realistic range for each demographic, such as varying the percentage of Black voters supporting Trump from 12% to a lower or higher figure based on historical trends and current political dynamics.

By running 10,000 simulations, we were able to create a probabilistic model that shows the likely distribution of votes each candidate would receive under different scenarios. This method provides a more robust analysis by considering the uncertainty and variability inherent in polling data. The results of these simulations help to capture the range of possible outcomes and offer a clearer picture of how small changes in voter preferences within each demographic could impact the overall election results.
Conclusion
The early polling and model data indicate a challenging road ahead for Vice President Kamala Harris as she steps into the presidential race. While Trump holds a slight edge in the polls and demographic models, the race is far from decided. The coming months will be crucial as both candidates work to solidify their bases and appeal to undecided voters. As the campaigns progress, it will be essential to monitor how these dynamics evolve and what new factors may come into play.
With the Democratic National Convention and subsequent campaign events on the horizon, a more comprehensive and accurate picture of the race will emerge. For now, the polls and models provide an early snapshot of a what could emerge as a competitive 2024 presidential election.